Communities & School Kitchens

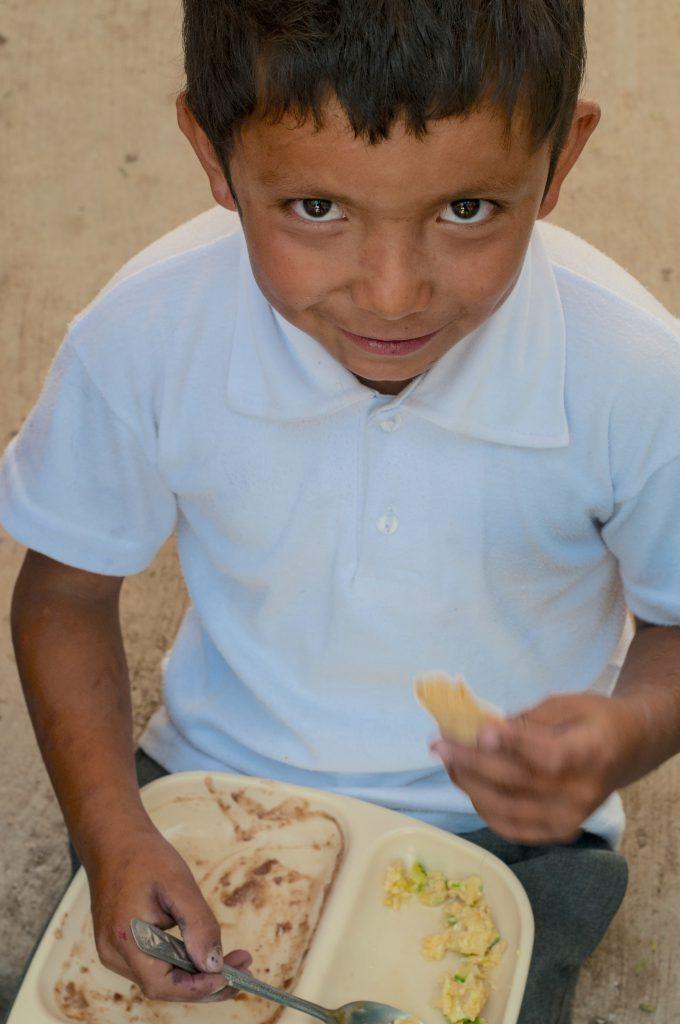
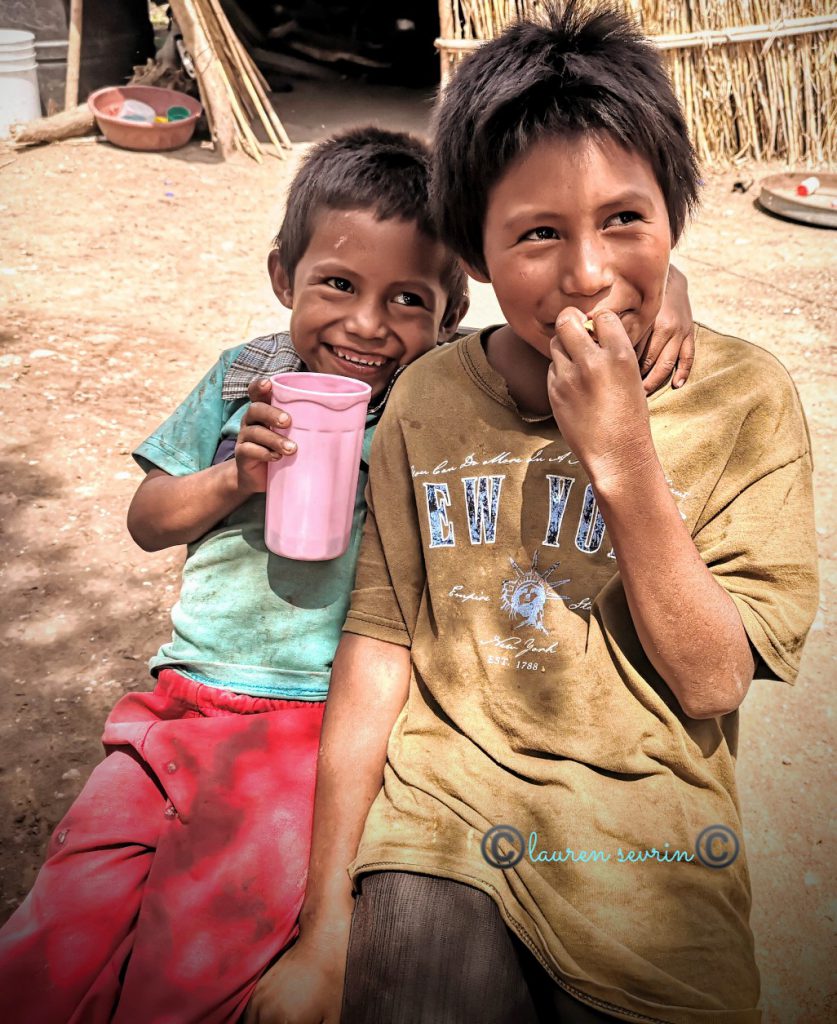
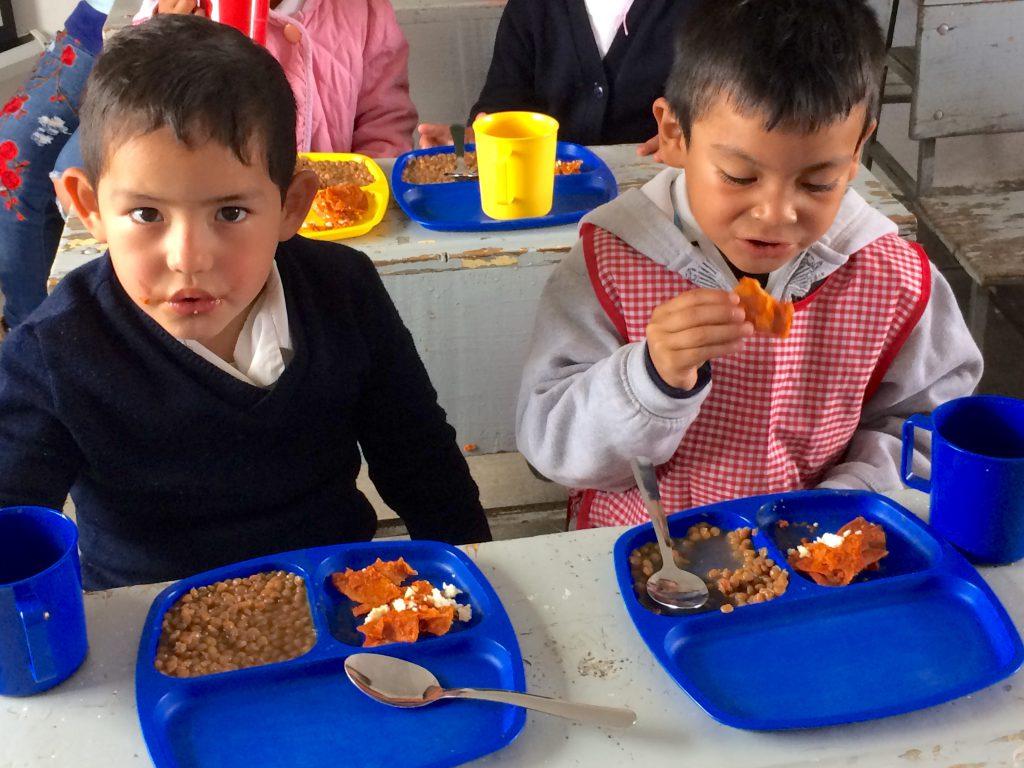
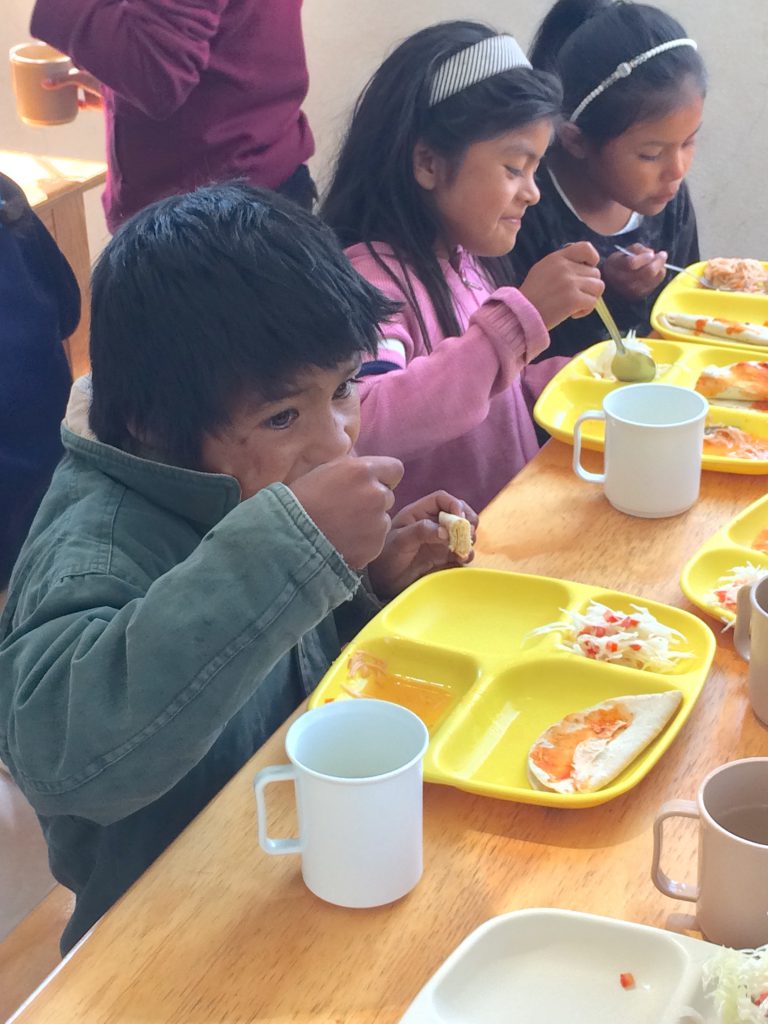
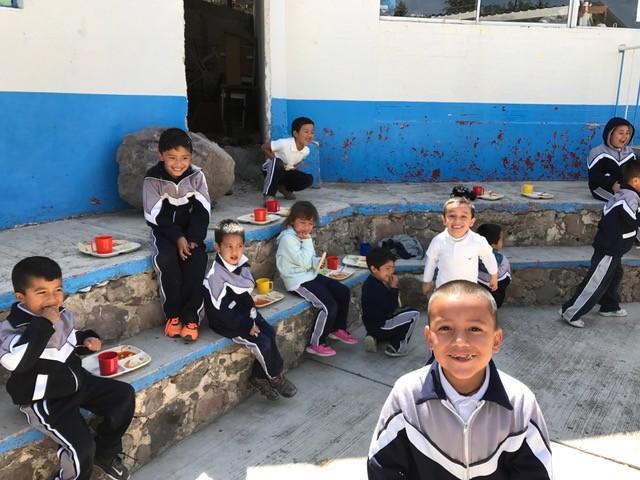
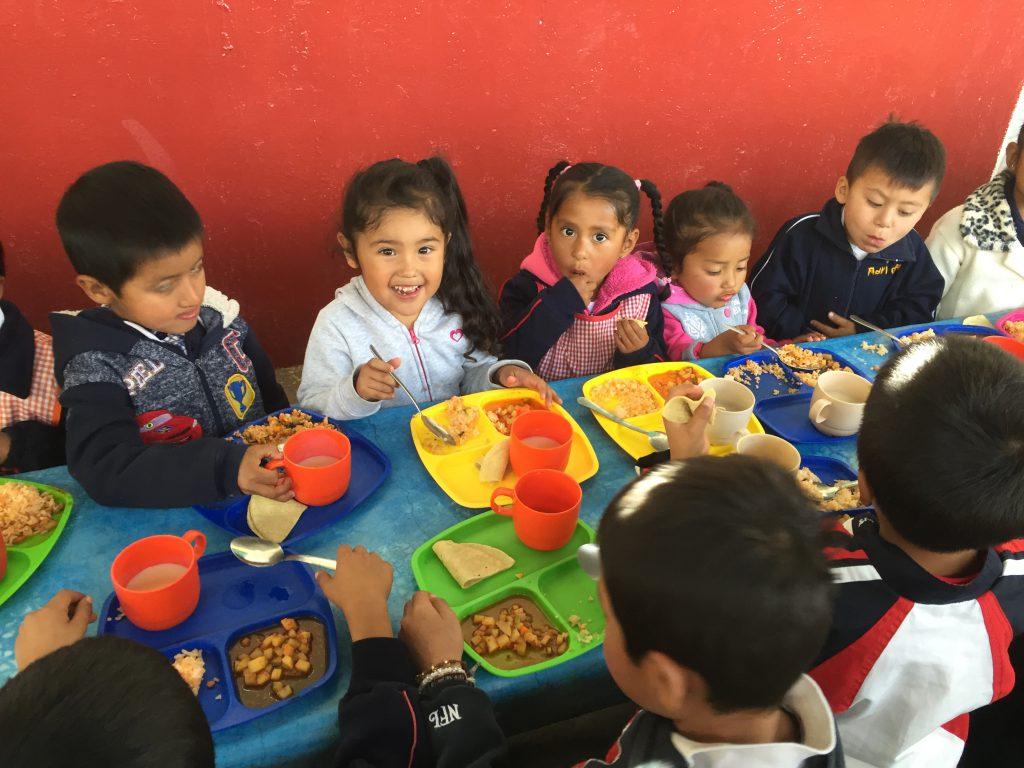
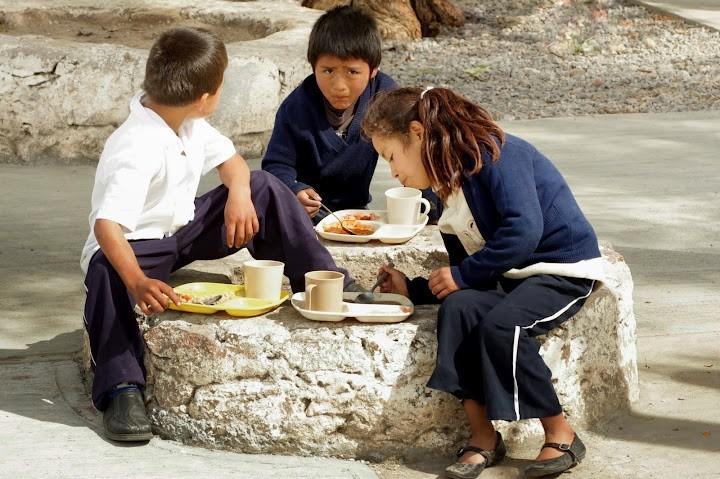
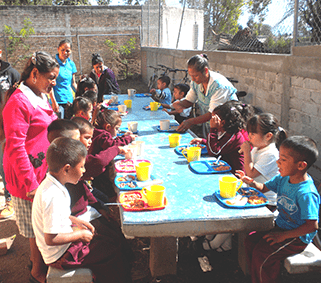
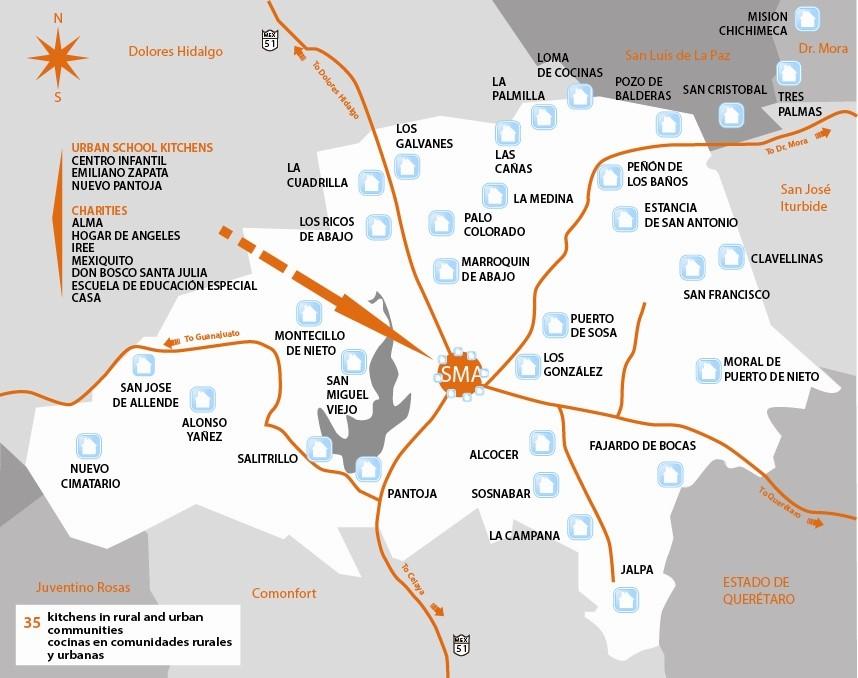
Feed the Hungry operates school kitchens in 35 communities in the San Miguel de Allende municipality, and one school kitchen in Misión Chichimeca, near San Luis de la Paz, which is outside of our self-imposed parameters. However, when we responded to their plea for help, the poverty of the community and the condition of the children was so devastating that we broke our own rules to include them in the hot meals program.

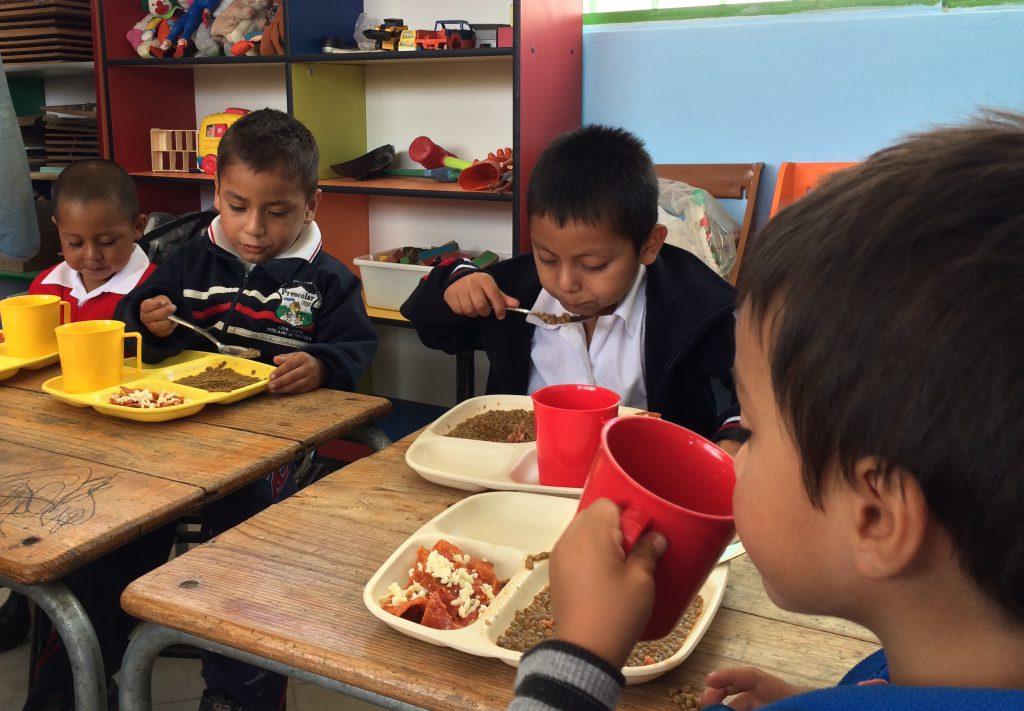
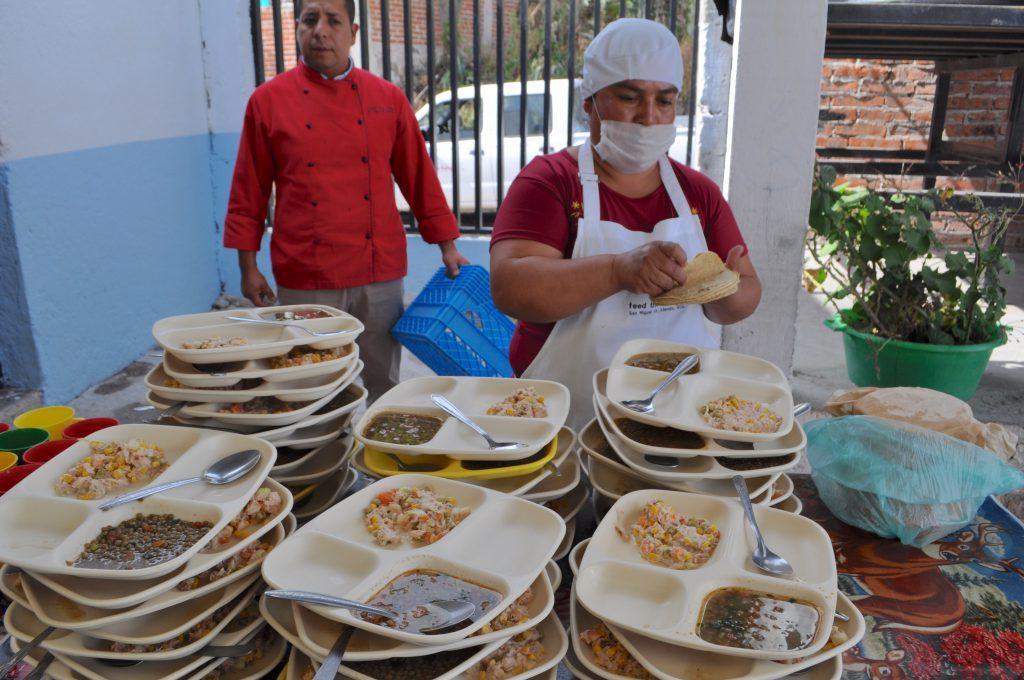
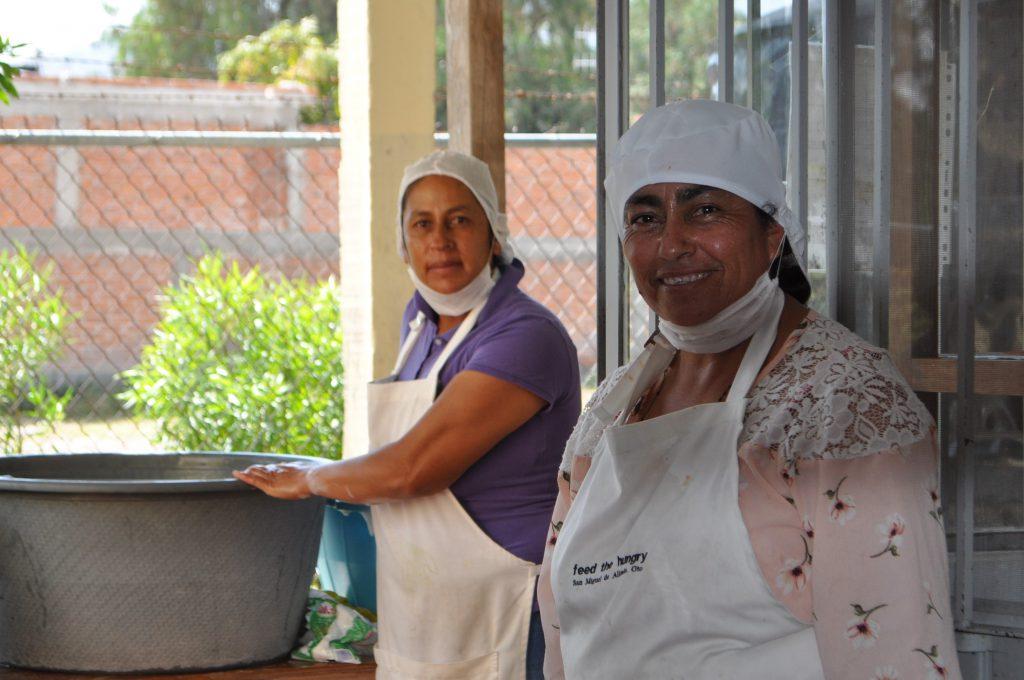
In addition, FTH supports seven charities with meal ingredients that are prepared at those facilities.

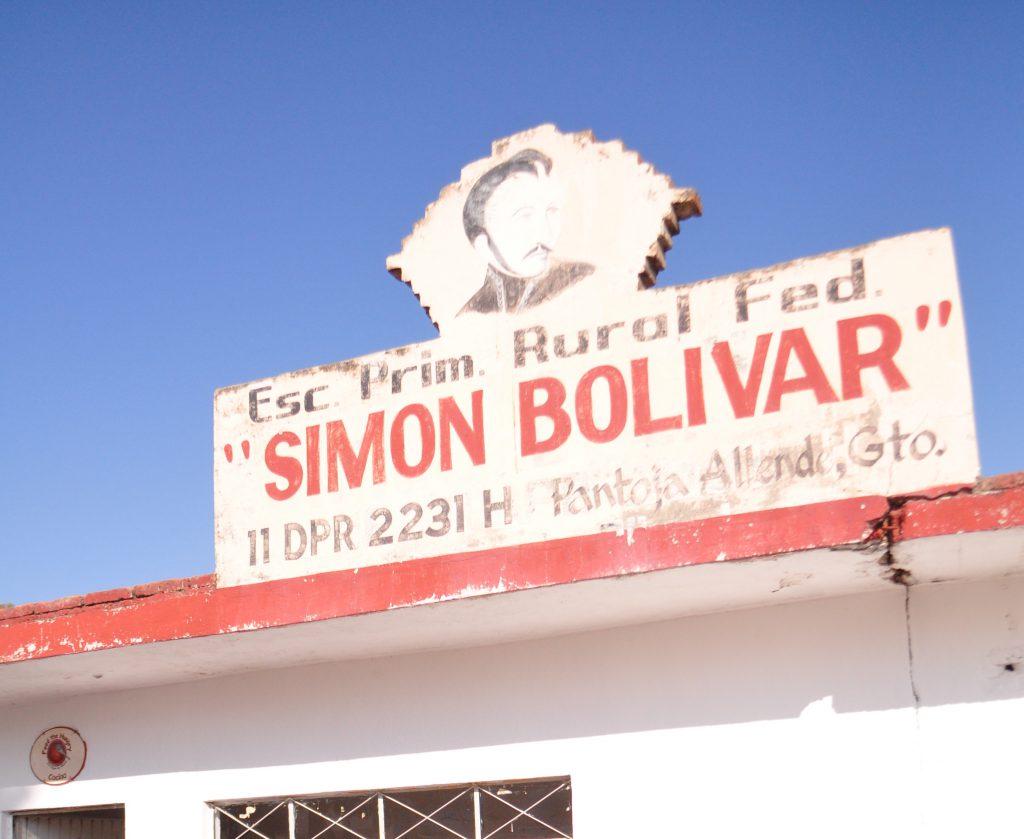
Click on any community name below for information about our work at that location, including demographics and progress of the Feed the Hungry meals program at each school.

Population statistics source: 2010 INEGI Census (Instituto Nacional de Estadística, Geografía e Informática).

Note: Reports have not been updated for 2020 because school kitchens have been closed since March, to the COVID-19 pandemic.
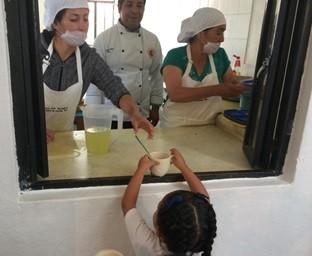
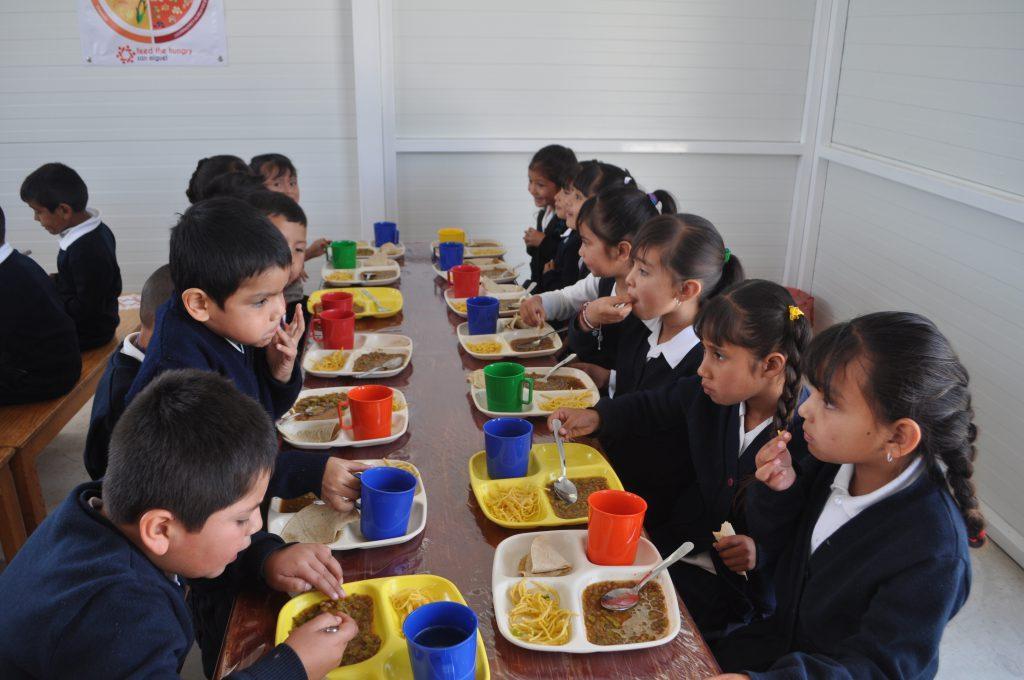
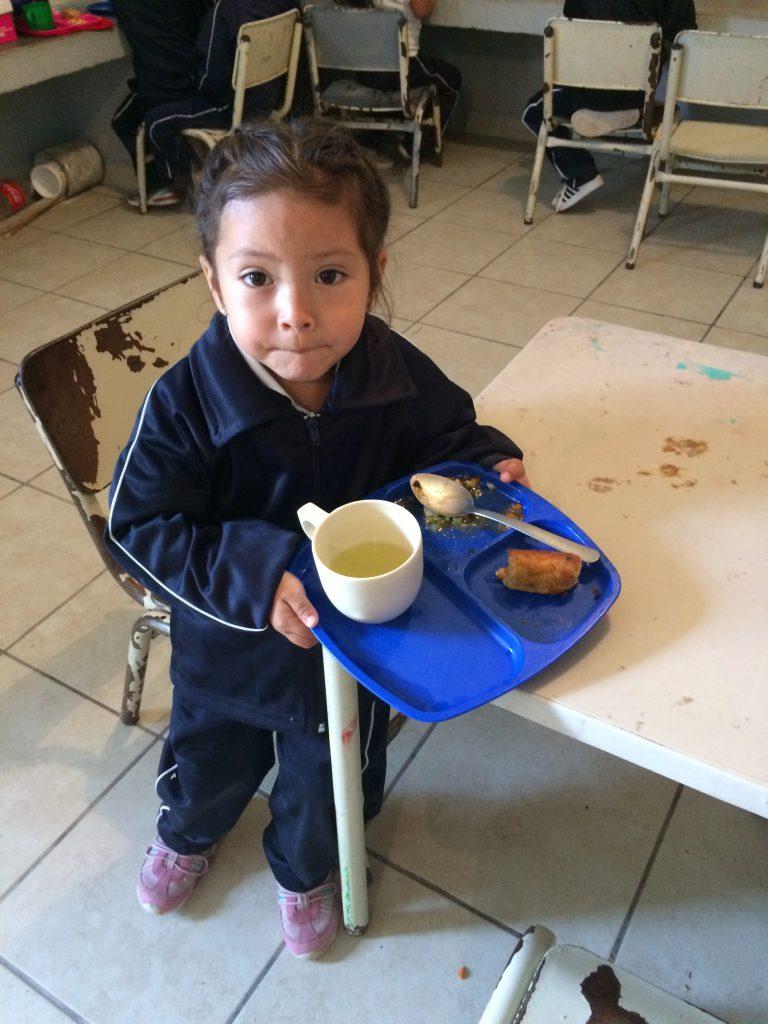
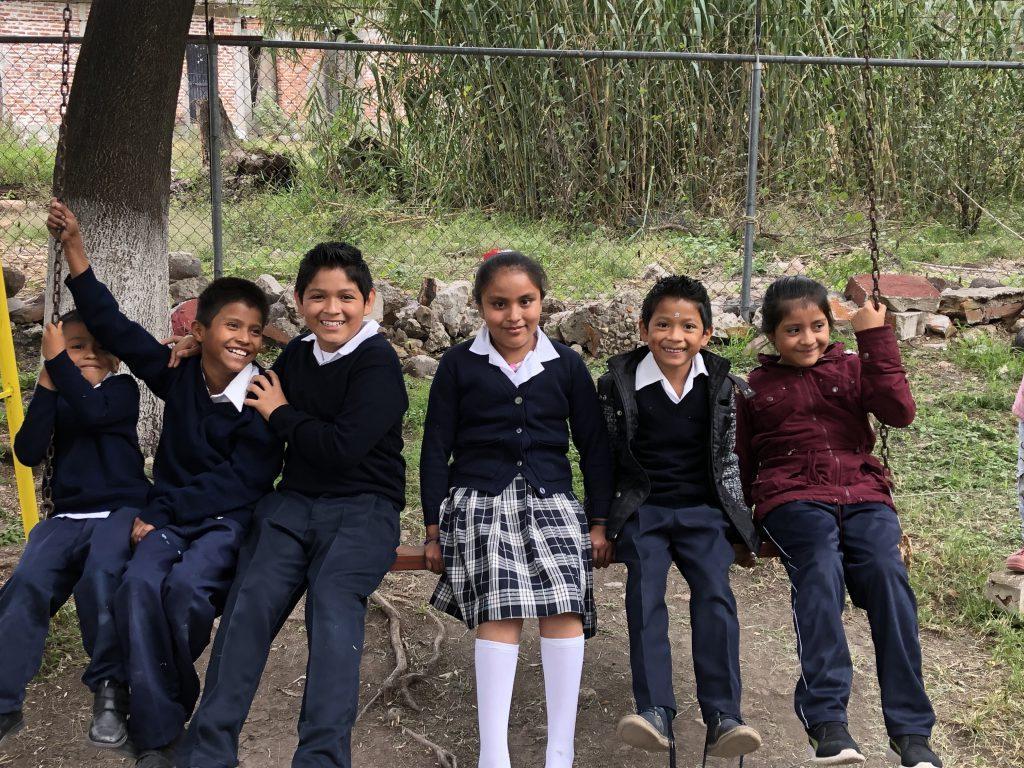
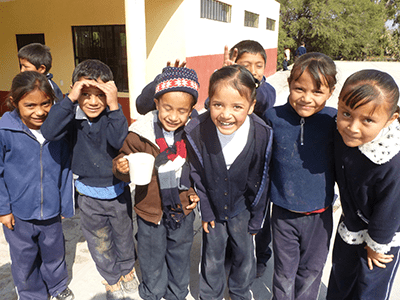
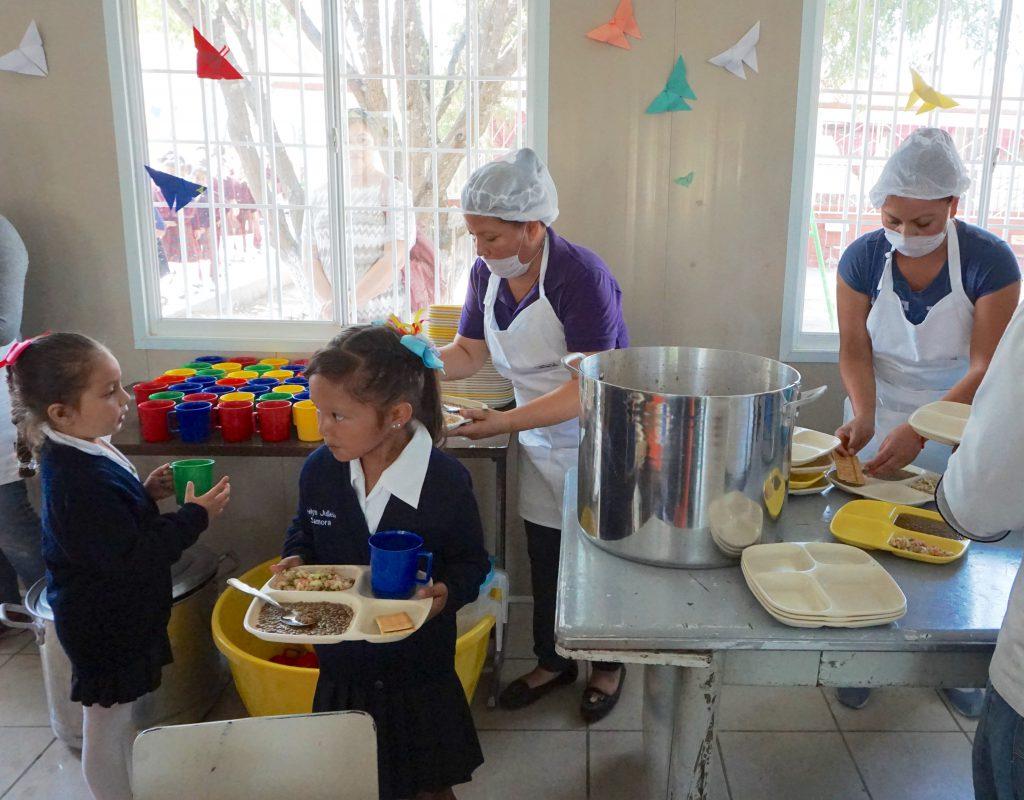
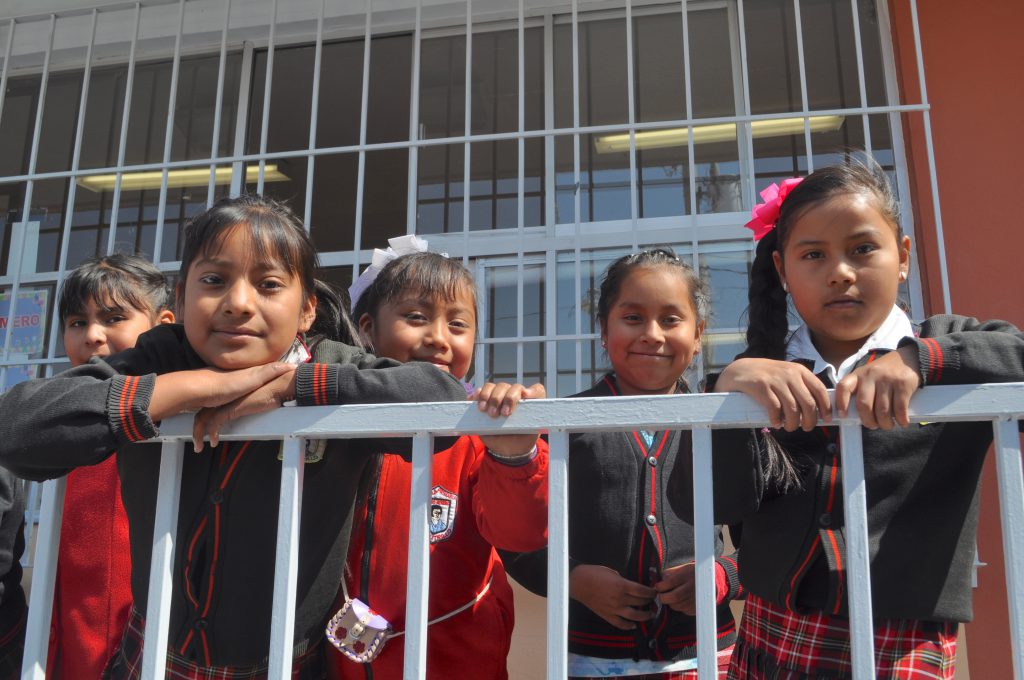
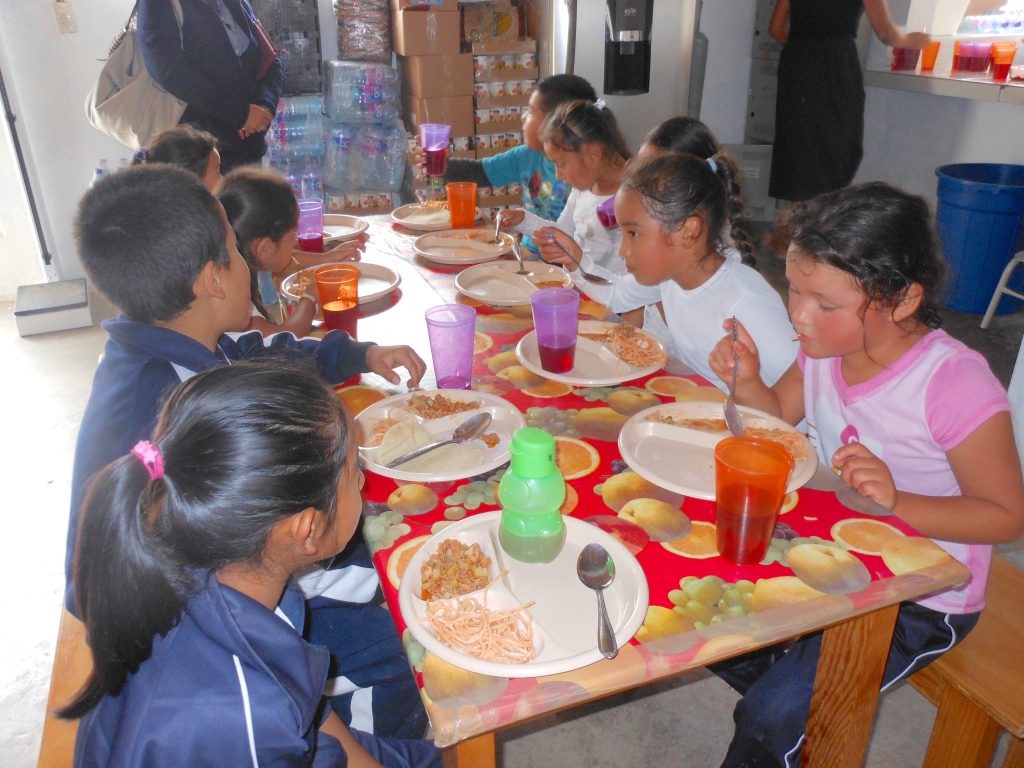
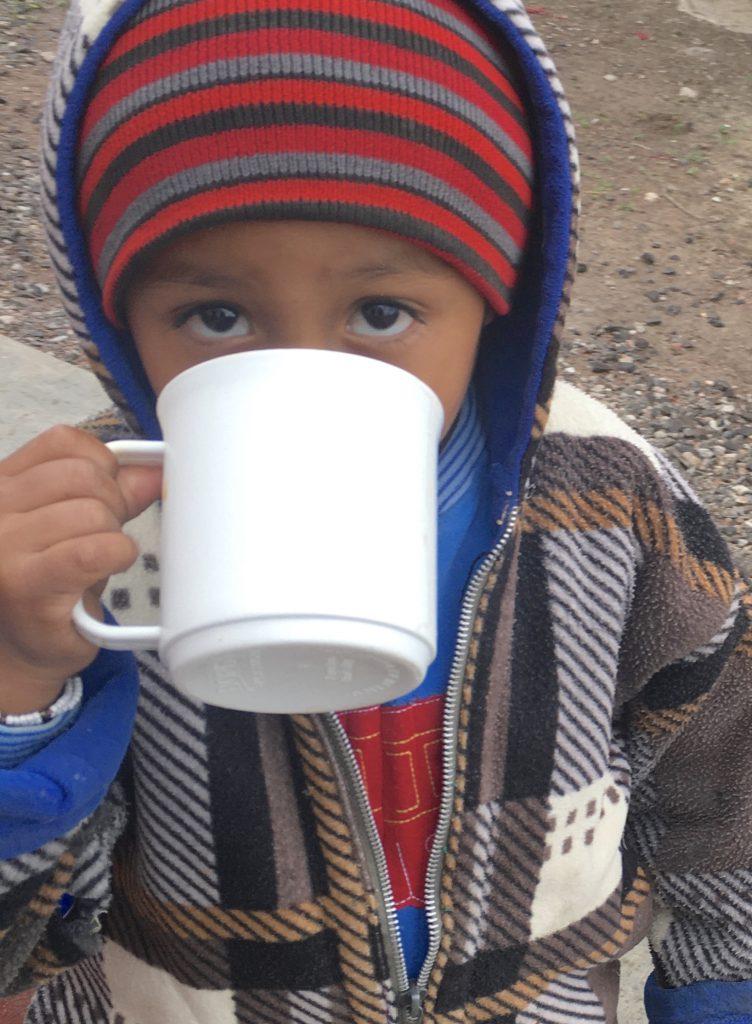
Community Reports

Note: Reports have not been updated for 2020 or 2021 because school kitchens have been closed since March 2020, due to the COVID-19 pandemic.

en_CAEN
Scroll to Top

Alcocer – “Melchor Ocampo” Preschool

Supported since: 2002
School meals served monthly: 950

Total village population: 1,224
Population age 0 to 14: 411
Number of households: 290
Households with all services –
electricity, water, and sewage: 253
Residents with some income: 413

Underweight school children
Light underweight: 17%
Moderate to severe underweight: 6%
Total underweight: 23%*

*This is a significant improvement – the 2016 health assessment revealed that 40% of the children measured were underweight. 

To learn more about our work in this community, read the full report HERE.

Alonso Yáñez – “Lázaro Cárdenas” Elementary & “Bertha Von Glumer Leyva” Preschool.

Supported since: April 14, 2015
School meals served daily: 200

Total village population: 475
Population age 0 to 12: 143
Number of households: 97
Households with all services –
electricity, water & sewage: 0
Residents with some income: 154

Underweight school children: 37%

Learn more about our work in the Alonso Yáñez community: click HERE.

Clavellinas – “Ignacio Ramírez” Elementary & “José María Luis Mora” Preschool.

Supported since: 2007

School meals served daily: >500

Total village population: 1,152
Population age 0 to 14: 539
Number of households: 219
Households with all services –
electricity, water, and sewage: 127
Residents with some income: 310

Underweight school children
Light underweight: 23%
Moderate underweight: 8%
Severe underweight: 5%
Total: 36%

To learn more about our work in the Clavellinas community, read the full report HERE.

Centro Infantil de los Ángeles – “Sigmund Freud” Kindergarten.

Centro Infantil de los Ángeles is an urban school only 4 kilometers away from the Feed the Hungry Center.

Supported since: 1999
School meals served daily: 63

Underweight school children
Light underweight: 11%
Moderate underweight: 30%
Severe underweight: 17%
Total: 58%

To learn more about our work in this community, please read our full report HERE.

Ejido de Tirado – “Emiliano Zapata” Kindergarten.

Supported since: 1997
School meals served daily: 150
Underweight school children
Light underweight: 44%
Moderate underweight: 15%
Severe underweight: 2%
Total: 61%

To learn more about our work in this community, please read our full report HERE.

Estancia de San Antonio – “Melchor Ocampo” Elementary & “Jaime Nunó” Preschool.

Supported since: 2007
School meals served daily: 138

Total village population: 562
Population age 0 to 14: 237
Number of households: 118
Households with all services –
electricity, water & sewage: 68

Residents with some income: 156

Underweight school children
Light underweight: 13%
Moderate underweight: 9%
Severe underweight: 6%
Total: 28%

To learn more about our work in this community, please read our full report HERE.

Fajardo de Bocas – “Emiliano Zapata” Elementary & “Don Miguel Hidalgo” Preschool.

Supported since: 2010
School meals served daily: 194

Total village population: 365
Population age 0 to 14: 120
Number of households: 96
Households with all services –
electricity, water & sewage: 37
Residents with some income: 94

Underweight school children
Light underweight: 19%
Moderate underweight: 8%
Severe underweight: 5%
Total: 32%

To learn more about our work in this community, please read our full report HERE.

La Campana – “Ignacio López Rayón” Elementary & “María Montessori” Preschool.

Supported since: 2006
School meals served daily: 374

Total village population: 916
Population age 0 to 14: 376
Number of households: 193
Households with all services –
electricity, water & sewage: 39
Residents with some income: 205

Underweight school children
Light underweight: 46%
Moderate underweight: 10%
Severe underweight: 2%
Total: 58%

To learn more about our work in this community please read our full report HERE.

Read about the launch of the Pre-Kinder Nutrition Program at La Campana HERE.

La Cuadrilla – “Juan Enrique Pestalozzi” Preschool, “Ignacio Manuel Altamirano” Elementary & State Telesecondary No. 710.

Supported since: 2001
School meals served daily: 100

Total village population: 487
Population age 0 to 14: 176
Number of households: 109
Households with all services-
electricity, water, and sewage: 9
Residents with some income: 163

Underweight school children
Light underweight: 35%
Moderate underweight: 16%
Total: 51%

To learn more about our work in this community, please read our latest report HERE.

La Palmilla – “Miguel Hidalgo” Elementary & “Juan José de los Reyes Martínez” Preschool.

Supported since: 2008
School meals served daily: 60

Total village population: 321
Population age 0 to 14: 118
Number of households: 65
Households with all services-
electricity, water & sewage: 29
Residents with some income: 135

Underweight school children
Light underweight: 43%
Moderate underweight: 12%
Total: 55%

To learn more about our work in this community, please click HERE to read our full report.

Las Cañas – “Francisco Villa” Elementary & “Pascual Ortiz Rubio” Preschool.

Supported since: 2004
School meals served daily: 157

Total village population: 779
Population age 0 to 14: 310
Number of households: 182
Households with all services –
electricity, water & sewage: 121
Residents with some income: 183
Illiteracy rate: 9%

Underweight school children
Light underweight: 17%
Moderate underweight: 10%
Severe underweight: 16%
Total: 43%

To learn more about our work in this community, please read our full report HERE.

Loma de Cocinas – “Cuauhtémoc” Elementary & “20 de Noviembre” Kindergarten.

Supported since: 2007
School meals served daily: 140

Total village population: 282
Population age 0 to 14: 109
Number of households: 60
Households with all services –
electricity, water & sewage: 16

Underweight school children
Light underweight: 20%
Moderate underweight: 4%
Severe underweight: 2%
Total: 26%

To learn more about our work in this community, please read our full report HERE.

Los González – “Josefa Ortiz de Domínguez” Elementary & “Benito Díaz de Gamarra” Kindergarten.

Supported since: 2017
School meals served daily: 132

Total village population: 428
Population under 12 years of age: 304
Number of households: 94
Households with all services –
electricity, water & sewage: 67
Average level of schooling: 5 years
Illiteracy rate: 16%

To learn more about our work in this community, please read our full report HERE.

La Medina – “México Creo en Tí” Preschool.

Supported since: 2017
School meals served daily: 65

Total village population: 257
Population under 12 years of age: 182
Number of households: 57
Illiteracy rate: 11%
Average level of schooling: 5.44 years

Underweight school children
Light underweight: 24%
Moderate underweight: 8%
Severe underweight: 0%
Total: 32%

To learn more about our work in this community, please read our full report HERE.

Los Galvanes – “Carmen Ramos del Río” Preschool

Supported since: 2003
School meals served daily: 75

Total village population: 1,364
Residents under the age of 12: 1,003
Number of households: 284
Households with all services –
electricity, water & sewage: 126
Residents with some income: 453

Underweight school children
Light underweight: 23%
Moderate underweight: 9%
Total: 32%

To learn more about our work in this community, please read our report HERE.

Los Ricos de Abajo – “Naciones Unidas” Elementary & “Helen Keller” Preschool.

Supported since: 2004
School meals served daily: 79

Total village population: 364
Population age 0 to 14: 124
Number of households: 78
Households with all services –
electricity, water & sewage: 26
Residents with some income: 128

Underweight school children
Light underweight: 17%
Moderate underweight: 6%
Severe underweight: 23%
Total: 46%

Read our full report HERE.

Learn about the donor-supported English language program run by Feed the Hungry board members and volunteers, plus the special challenges our delivery drivers must deal with to reach this village, HERE.

Marroquín de Abajo – “Mariano Matamoros” Elementary & “Itzcoatl” Kindergarten

Supported since: 2008
School meals served daily: 85

Total village population: 283
Population age 0 to 14: 96
Number of households: 64
Households with all services –
electricity, water & sewage: 37
Residents with some income: 105

Underweight school children
Light underweight: 13%
Moderate underweight: 4%
Total: 17%

To learn more about our work in this community, please read our full report HERE.

Misión Chichimecas, Plan Juárez – “Majurru” Bilingual Elementary.

Supported since: 2006
School meals served daily: 103

Statistics listed are for Misión Chichimeca. (Source: 2010 INEGI – Instituto Nacional de Estadística, Geografía e Informática – Census.)

Total village population: 6716
Population age 0 to 14: 3037
Number of households: 1155
Households with all services –
electricity, water, and sewage:   534
Residents with some income: 2178

Underweight school children
Light underweight: 9%
Moderate underweight: 28%
Severe underweight: 26%
Total: 63%

Plan Juárez is a single room school house in the sparsely populated area within Misión Chichimeca. During the 2017-2018 school cycle, the children were given a larger meal portion to meet nutritional needs as it was very likely that the FTH meal was the only one they received each day. Early in 2019, the Early Childhood Nutrition program and the addition of a second daily school meal was introduced in this community.

Since the increase of food portions in 2017, we have seen the percentage of underweight children drop to 63%, a reduction of 13% from the prior year.

Read our full report HERE.

Montecillo de Nieto – “El Pípila” Elementary & “Emiliano Zapata” Preschool.

Supported since: 2014
School meals served daily: 70

Total village population: 294
Population under 12 years of age: 210
Number of households: 56
Households with piped water: 6
Households with all services –
electricity, water & sewage: 5
Residents with some income: 103

Underweight school children
Light underweight: 22%
Moderate underweight: 7%
Total: 29%

To learn more about our work in this community, please read our full report HERE.

Moral de Puerto de Nieto – “Prof. Graciano Sánchez” Elementary.

Supported since: 2017
School meals served daily: 195

Total village population: 945
Population under 12 years of age: 696
Number of households: 226
Households with all services –
electricity, water & sewage: 150
Illiteracy rate: 13%

Learn more about our work in this community: click HERE to read our full report.

Nuevo Cimatario – “Miguel Hidalgo” Elementary and “José María Morelos” Kindergarten.

Supported since: 2018
School meals served daily: 120
Total village population: 285
Number of households: 72
Households with piped water: 0
Adult residents with some income: 30%
Illiteracy rate: 17%
Average level of schooling: 4 years

(Source: 2010 INEGI Census (Instituto Nacional de Estadística, Geografía e Informática.)

Nuevo Cimatario is a community on the San Miguel de Allende municipal government’s list of rural populations in greatest need. It is 65 km from the Feed the Hungry center; one of our farthest delivery locations.

A new school kitchen was opened in 2018. However, the building was too small for all of the children to be seated at mealtime, so the majority of them had to take their meals outside. The preschool was in a cold, dark outbuilding built with adobe and asbestos 80 years ago.

A new kitchen/dining room opened on December 5, thanks to FTH supporter, architect Rafael Franco, who donated time and materials for construction. View the video.

Read the full report HERE.

Nuevo Pantoja – “Francisco Ferrer Guardiola” Preschool & “Virginia G. de Anguiano” Elementary.

Total village population: 204
Population under 12 years of age: 126
Number of households: 47
Households with all services –
electricity, water & sewage: 1
Residents with some income: 71

Preschool (Kinder)
Supported since: 2017
School meals served daily: 96

Elementary (Primaria)
Supported since: 2019
School meals served daily: 150

For more information about our work in this community, click on either one of the following links:

Pantoja – “Simón Bolívar” Elementary & “Lucas Alamán” Preschool.

Supported since: 2014
School meals served daily: 80

Total village population: 381
Population under 12 years of age: 259
Number of households: 84
Households with all services –
electricity, water & sewage: 37
Residents with some income: 147

Underweight school children
Light underweight: 10%
Moderate underweight: 3%
Severe underweight: 3%
Total: 16%

To learn more about our work in this community, please read our full report HERE.

Palo Colorado – “María Montessori” Kindergarten.

Supported since: 2003
School meals served daily: 150

Total village population: 1,172
Population age 0 to 14: 519
Number of households: 212
Households with all services –
electricity, water & sewage: 71
Residents with some income: 346

Underweight school children
Light underweight: 38%
Moderate underweight: 5%
Severe underweight: 2%
Total: 45%

To learn more about our work in this community, please read our full report HERE.

Click HERE to watch a video of the Palo Colorado children enjoying a hot nutritious lunch provided by Feed the Hungry San Miguel.

Peñón de los Baños – “Lázaro Cárdenas” Elementary & “Antonio Caso” Preschool.

Supported since: 2007
Children currently served school meals: 80

Total village population: 283
Population aged 12 or younger: 211
Number of households: 71
Households with all services –
electricity, water & sewage: 43
Illiteracy rate: 7%
Average level of schooling: 6 years

Underweight school children
Light underweight: 27%
Moderate underweight: 5%
Severe underweight: 0%
Total: 32%

To learn more about our work in this community, please read our full report HERE.

Pozo de Balderas – “Ricardo Flores Magón” Elementary & “Narciso Mendoza” Preschool.

Supported since: 2007
School meals served daily: 98

Total village population: 366
Population age 12 and younger: 74%
Number of households: 71
Households with all services –
electricity, water & sewage: 57
Illiteracy rate: 28%

Underweight school children
Light underweight: 19%
Moderate underweight: 2%
Severe underweight: 2%
Total: 23%

To learn more about our work in this community, please read our full report HERE.

Puerto de Sosa – “General Francisco Villa” Elementary & “Ovidio de Krolly” Kindergarten.

Supported since: 2017
School meals served daily: 105

Total village population: 556
Population under 12 years of age: 417
Number of households: 118
Households with all services –
electricity, water & sewage: 104
Average level of schooling: 5 years
Illiteracy rate: 13%

Learn more about our work in this community: click HERE to read our full report.

Salitrillo – “Pedro Moreno” Elementary.

Supported since: 2018
School meals served daily: 134

Total village population: 242
Residents under 12 years of age: 176
Number of households: 56
Households with all services –
electricity, water & sewage: 15
Average level of schooling completed: 5 years
Illiteracy rate: 10%

To learn more about our work in this community, please read our report HERE.

San Cristóbal – “Constitución de 1857” Elementary & “Niños Héroes” Preschool.

Supported since: 2001
School meals served daily: 100

Total village population: 215
Number of households: 51
Households with all services –
electricity, water & sewage: 40
illiteracy rate: 14%

Underweight school children
Light underweight: 33%
Moderate underweight: 5%
Severe underweight: 1%
Total: 39%

To learn more about our work in this community please read our full report HERE.

San Francisco – “Ma. Esther Rodríguez Flores” Elementary & “Jn. Anagua” Preschool.

Supported since: 2008
School meals served daily: 93

Total village population: 295
Population age 0 to 14: 141
Number of households: 55
Households with all services –
electricity, water & sewage: 36
Residents with some income: 79

Underweight school children
Light underweight: 22%
Moderate underweight: 5%
Severe underweight: 1%
Total: 28%

Learn more about our work in this community: read our latest report HERE.

San José de Allende – “Ignacio Allende” Elementary & “Diego Rivera” Kindergarten.

Supported since: 2018
School meals served daily: 210

Total village population: 899
Number of households: 172
Households with all services –
electricity, water & sewage: 49
Illiteracy rate: 18%

Underweight school children
Light underweight: 19%
Medium underweight: 13%
Severe underweight: 12%
TOTAL: 44%

To learn more about our work in this community, please read our full report HERE.

San Miguel Viejo – “Benito Juárez” Elementary.

Supported since: 2003
School meals served daily: 70

Total village population: 669
Population age 12 and younger: 461
Number of households: 128
Households with all services –
electricity, water, and sewage: 79

Underweight school children
Light underweight: 20%
Moderate underweight: 18%
Severe underweight: 2%
Total: 40%

To learn more about our work in this community, please read our full report HERE.

Sosnabar – “Naciones Unidas” Elementary & “José de los Reyes Martínez” Preschool.

Supported since: 2011
School meals served daily: 240

Total village population: 1,035
Population age 0 to 14: 404
Number of households: 212
Households with all services –
electricity, water, and sewage: 76
Residents with some income: 301

Underweight school children
Light underweight: 33%
Moderate underweight: 9%
Severe underweight: 0%
Total: 42%

To learn more about our work in this community, please read our full report HERE.

Tres Palmas – “Ignacio Zaragoza” Elementary & “Prof. Paul Martínez de Anda” Telesecondary.

Supported since: 2014
School meals served daily: 98

Total village population: 308
Population age 0 to 14: 117
Number of households: 63
Households with all services –
electricity, water & sewage: 46

Supported since: 2014
School meals served daily: 98

Total village population: 308
Population age 0 to 14: 117
Number of households: 63
Households with all services –
electricity, water & sewage: 46

To learn more about our work in this community please read our full report HERE.

Open chat
Need more info?
Feed the Hungry's Chat
Hello 👋
Can we help you?
Call Now Button